Introduction
London hosted the championship-deciding final round of the UCI Track Champions League in December 2022, and we had the pleasure of being invited to test both our Aerosensor and Aerobody products to demonstrate how they could provide realtime feedback on cycling aerodynamics in a racing environment.
Former UCI World Scratch Champion Sebastian Mora completed two twenty-minute sessions during his warmup on track for us.
In the first he was out on track by himself, and switched every few laps between a low and a high body position so we were able to correlate his position with his drag coefficient, CdA.
In the second, he held a constant body position, but ran in all the positions of a 4-rider peloton, so we could look at the effect of position on his aerodynamics.
In normal operation, Aerosensor requires tens of seconds of data to provide a useable average CdA figure. However in racing the situation is constantly changing, so we wanted to see if there was a way to provide more immediate information on the rider’s drag.

Figure 1: Sebastian Mora with Aerosensor and Aerobody.
Test
The Aerosensor drag measurement and Aerobody position units were installed on Sebastian’s track bike as shown in Figure 2.
To calculate aerodynamic drag, Aerosensor requires a speed and power meter, and for this purpose it was paired with a Sigma magnet-based speed sensor and Favero Assioma Duo dual pedal power meter.

Figure 2: Track bike with Aerosensor and Aerobody fitted.

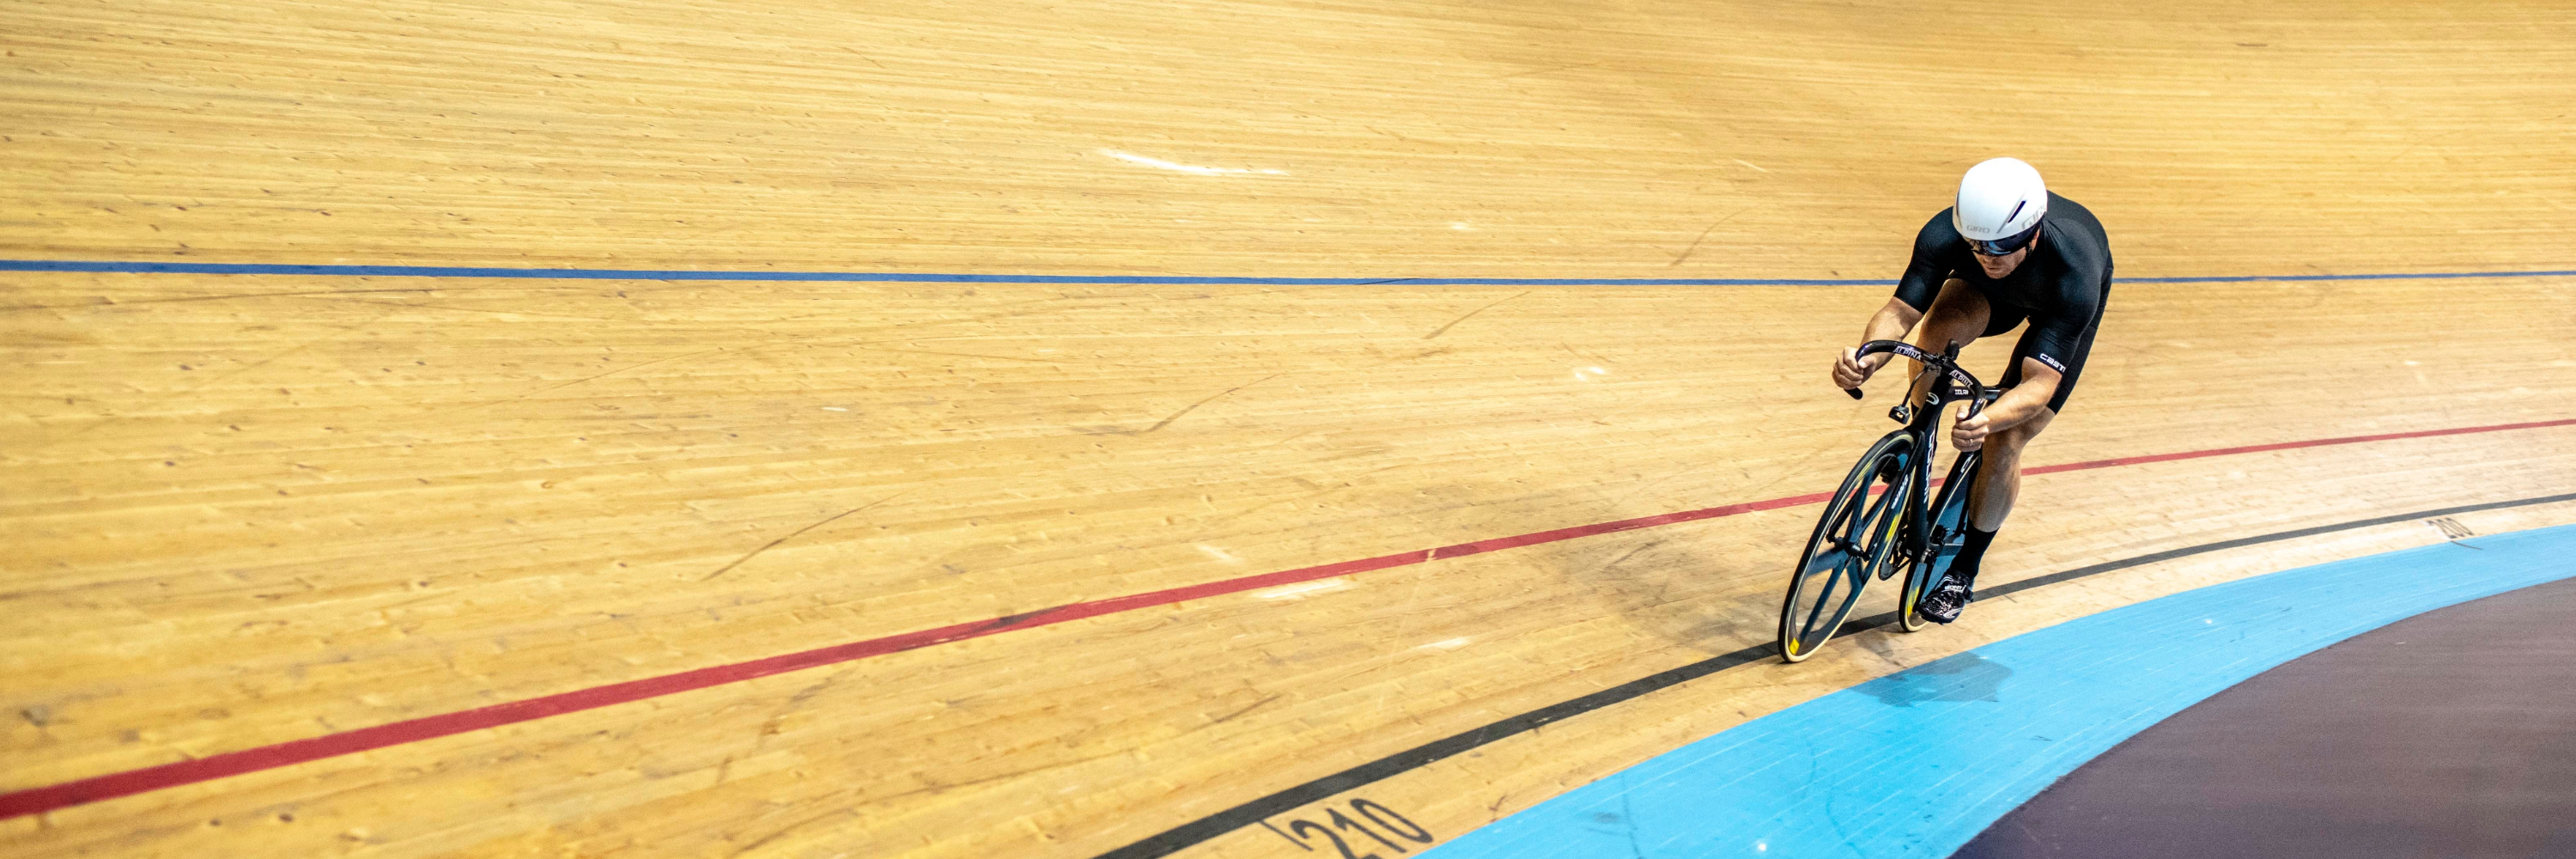
Figure 3: Sebastian Mora riding solo during the first session.
In the first session, Sebastian rode in free air to focus on establishing the effect of his body position and CdA (Figure 3). Alternating every two laps between a higher position and a more ‘aero’ lower position this created a perturbation in his riding position that we could capture.
In the second session Sebastian rode in a group of four riders to look at how peloton position impacted drafting and the subsequent required rider power. He moved from the back of the line all the way to the lead position, spending a few laps in each position.
Results
Table 1 below shows average data for each segment of the first session, where a 'low' and 'high' position were alternated, together with overall averages for each position, and differences between them.
| Segment type | Head height (cm) | Chest height (cm) | CdA | Aero Watts @ 45kph |
| Low | 27.6 | 27.7 | 0.217 | 254 |
| Low | 28.7 | 27.8 | 0.211 | 248 |
| Low | 29.0 | 27.3 | 0.210 | 246 |
| High | 32.2 | 30.5 | 0.229 | 269 |
| High | 32.0 | 29.6 | 0.223 | 261 |
| High | 33.3 | 30.1 | 0.220 | 258 |
| High | 33.7 | 30.2 | 0.225 | 264 |
| Low average | 28.4 | 27.6 | 0.213 | 249 |
| High average | 32.8 | 30.1 | 0.224 | 263 |
| Difference | 4.4 | 2.5 | 5.6% | 14 |
Table 1: Body position and Aerodynamic Drag in first session
- An average drop in height of 4.4cm at the head, and 2.5cm at the chest reduced Sebastian's drag by 5.6%
- Sebastian was averaging about 45kph, so this represents a reduction in rider power of approximately 14 watts (or 5.3%)
- Measuring rider position is key to achieving an accurate CdA estimate
The graph below shows both CpT and rider power (with a 10s rolling average), with rider position in the peloton marked out in this second run - note the effective "total pressure coefficient" (CpT) is a measure of how much the onset wind is reduced by the leading riders (with no leading rider this CpT would be 1.0).

Figure 4: Total pressure coefficient and rider power for different peloton positions
Since we want to understand change in drag relative to free air, we use a "synthetic CdA", which is based off wheel speed rather than actual wind. This data is shown in the following table, together with CpT and average rider power.
| Position | CpT | CdA (m2) | Power (W) |
| 1 | 1.001 | 0.218 | 294.4 |
| 2 | 0.551 | 0.143 | 190.4 |
| 3 | 0.327 | 0.114 | 144.1 |
| 4 | 0.362 | 0.115 | 147.4 |
Table 2: Average-data values from the second session.

Figure 5: Average-data values from the second session.
Conclusions
- Drag reduces from first to second, and second to third positions in the peloton - beyond that there is no measurable advantage in being further back
- This effect means the rider power is approximately halved with going from first to second position
- The windspeed measurement by Aerosensor (total pressure coefficient) correlates very well with aerodynamic drag for different positions in the peloton, meaning it can be used as a proxy for aerodynamic drag, allowing for instantaneous data which responds in less than a second of changes in peloton position
- Note that the straight line fit does not pass through zero - this is because the CpT measured is a little lower than the mean airflow since it is measured at a single location.
We'd like to thank everyone involved at the UCI Track Champions League for their hospitality, especially Sebastian for being our Guinea Pig!
If you'd like to get in touch regarding our devices, or if you have any questions please contact us at hello@aerosensor.tech